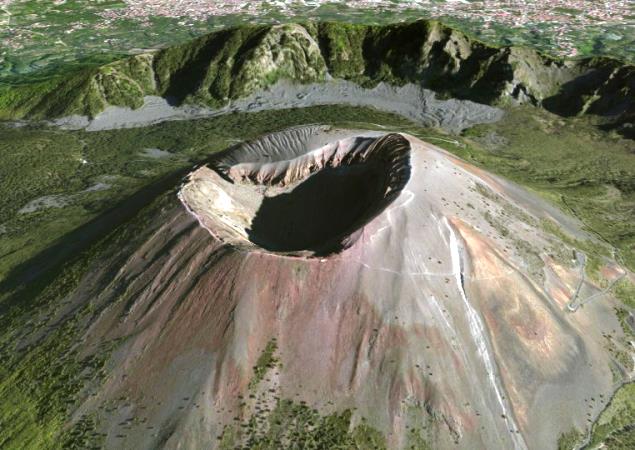
GEOFISICA - IMPACTO AMBIENTAL
It is remarkable that due to the presence of COVID-19 on our planet many things have changed, in addition to our habits in a personal and collective way, but even so despite this, our planet has had a respite, a period of rest time , making this opportunity a clear sign of the decrease in environmental pollution.
This is because various industries and companies have stopped their productions. The rates that were shown in times before COVID-19 had been high, but now due to the presence of COVID-19 these rates have decreased considerably. These indices can be plotted on a global "Nitrogen Dioxide" pollution map, from Europe to America. We can see the presence of this pollutant in a red hue in the various cities of any country.
This data is provided by ESA, the European Space Agency, publicly. The data presented has a period of 14 days. This online platform uses data from the Copernicus Sentinel-5P satellite. As if it were a Google Maps map, we can increase and decrease the map, move from one place to another and visualize the concentration of NO2 present. We can also change the dates of the visualization of these data to compare them over time, always remembering that they are for periods of 14 days. We share the link so that you can view the
NO2 POLLUTION MAP. You can also view the map
FROM HERE. (Wait 5 seconds of advertising)
We leave you some maps prepared by this online application, detailing the date range for each area studied. It is also worth mentioning that we will prepare the maps for each continent so that they can be downloaded from this post or by entering our download area for geophysicists.
 |
| NO2 Pollution Map in Africa |
 |
| NO2 Pollution Map in South America |
 |
| NO2 Pollution Map in Asia |
 |
| NO2 Pollution Map in Central America |
 |
| NO2 Pollution Map in Europe |
 |
| NO2 Pollution Map in North America |
 |
| NO2 Pollution Map in Oceania |
Remember that Nitrogen Dioxide is a by-product of combustion at high temperatures, as in motor vehicles and power plants. For this reason it is a frequent pollutant in urban areas, mainly affecting the respiratory system. (1) It should also be noted that these images can be used for research on Environmental Impact.
BIBLIOGRAPHIC REFERENCE
(1) https://es.wikipedia.org/wiki/Di%C3%B3xido_de_nitr%C3%B3geno
(2) http://www.esa.int/Space_in_Member_States/Spain/Disponibles_mapas_globales_de_contaminacion_del_aire


0 Comments:
Publicar un comentario
No olvides de escribir tu opinión personal de nuestro blog, una página o información que desees comprtir. Todos los éxitos para ti. Gustavo Zavala.